
티스토리 뷰
figure
figure: 그래프가 그려지는 가장 큰 액자의 개념
axes : 하나의 그래프. 하나의 figure에 여러 개의 axes를 가질 수 있음
axis: 축. 하나의 axes는 x축, y축(2개의 axis)를 갖는다.
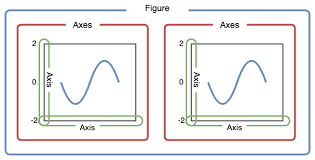
figure 함수
크기 지정
- figure의 크기를 지정함
- plt.figure(figsize=(가로, 세로))
import matplotlib.pylab as plt

plt.figure(figsize=(10, 5)
그래프 x축, y축 범위 지정
- 그래프(axes)의 x축 y축에서 표현될 최소, 최대값을 지정함
- plt.xlim(최소, 최대)
- plt.ylim(최소, 최대)
import matplotlib.pylab as plt

plt.figure(figsize=(10, 5))
plt.plot(x, y, color="darkblue", linewidth=3, linestyle="--", marker="o", ms=15, mec="orange", mew=3, mfc="yellow")
plt.xlim(0, 50)
plt.ylim(0, 10)
plt.show()
그래프 x축 ,y축, 제목 텍스트 지정
- plt.xlabel('X축')
- plt.ylabel('Y축')
- plt.title('타이틀')
- 텍스트의 폰트 옵션은 rc 함수로 조정 가능
plt.figure(figsize=(15, 5))
font={'family':'monospace', 'weight':'bold', 'size':30}
plt.rc('font', **font)     # 폰트 사이즈 변경
plt.plot(x, y, color="darkblue", linewidth=3, linestyle="--", marker="o", ms=15, mec="orange", mew=3, mfc="yellow")
plt.xlabel("X")
plt.ylabel("Y")
plt.title("title")
plt.show()
X축, Y축 눈금(tick) 지정
- 그래프에서 축에 표시되는 눈금의 범위와 개수를 설정할 수 있음
- plt.xticks(np. linespace(최소값, 최대값, 눈금 개수)
- plt.yticks(np. linespace(최소값, 최대값, 눈금 개수)
범례(legend) 설정
- 그래프의 범례 텍스트와 위치를 설정할 수 있음
- 위치를 설정하지 않으면, 표시되지 않음
- plt.plot(label=텍스트)
- plt.legend(loc=위치명)
- loc = [best, upper right, upper left, lower left, lower right, right, center left, center right, lower center, upper center, center]
x = np.array([10, 20, 30, 40, 50, 60, 70, 80])
y = np.array([1, 3, 5, 7, 9, 11, 13, 15])
plt.plot(x, y, label='1번 그래프')
plt.legend(loc='center left')
plt.show()
'데이터 시각화' 카테고리의 다른 글
| [matplotlib 그래프 튜토리얼] 06. 그래프 (pie) (0) | 2023.12.28 |
|---|---|
| [matplotlib 그래프 튜토리얼] 05. 그래프 (bar) (0) | 2023.12.28 |
| [matplotlib 그래프 튜토리얼] 04. 그래프 (subplot, multi-line) (0) | 2023.12.28 |
| [matplotlib 그래프 튜토리얼] 02. plot (style.context, with) (1) | 2023.12.28 |
| [matplotlib 그래프 튜토리얼] 01.plot (스타일 옵션) (1) | 2023.12.27 |
댓글
공지사항
최근에 올라온 글
최근에 달린 댓글
- Total
- Today
- Yesterday
링크
TAG
- iOS 검은 화면
- 웹 배포
- python 웹 배포
- 실시간 데이터베이스
- django 로그인접근
- django pythoneverywhere
- Firebase 데이터베이스 추천
- 장고 게시판
- 장고 태그달기
- pythonanywhere배포방법
- 알파벳 카운팅
- iOS 화면 안나옴
- UITableViewController Not Working
- pythonanywhere배포
- 데이터베이스 추천
- 까만 화면
- iOS 데이터베이스
- Django
- 테이블출력안됨
- django clean
- django tag
- CellForRowAt Not Called
- iOS UITableView 출력안됨
- cleaned_data
- django 게시판
- Realtime Database
- CellForRowAt 호출안됨
- django 개발일지
- ModelForm Form 차이
- django 태그
| 일 | 월 | 화 | 수 | 목 | 금 | 토 |
|---|---|---|---|---|---|---|
| 1 | 2 | 3 | 4 | 5 | ||
| 6 | 7 | 8 | 9 | 10 | 11 | 12 |
| 13 | 14 | 15 | 16 | 17 | 18 | 19 |
| 20 | 21 | 22 | 23 | 24 | 25 | 26 |
| 27 | 28 | 29 | 30 |
글 보관함